
Results of the study on agency quality
The study tested its model against the judgments of contractors of two international agency networks. Four of the seven core hypotheses were accepted, including two reference paths that cannot be tested individually. Because the initial model was confirmed only in parts, the study simplified it in three steps. In the final model, leadership efficiency dominates, and communication quality shows itself above all in the trust of the contractor’s customers. The study could not demonstrate an effect on financial value.
Data basis
The evaluation is based on 209 complete questionnaires from these contractors, each with a completed order of more than €100,000. The participation quota and the composition of the sample are described on the page Method.
Each questionnaire contained 20 statements. Twelve concerned the agency’s enablers and were rated from 1 (poor performance) to 5 (top performance). Eight concerned success in the respondent’s own company and ranged from 1 (no consent) to 5 (maximum consent). The evaluation used a structural equation model (SEM). In the study, a path with p < 0.10 counts as significant.
The seven core hypotheses
The hypotheses follow the logic of the QMC model. The first four hypotheses assume that each enabler raises communication quality. Hypotheses 5 to 7 assume that this quality produces three kinds of success at the contractor, customer value, social value and financial value. Communication quality itself is a latent variable. It is not asked about directly but estimated from the interplay of the enablers and the success parameters.
| No. | Path | Estimate | S.E. | C.R. | p | Result |
|---|---|---|---|---|---|---|
| H1 | Leadership efficiency → communication quality | 1 (reference path) | – | – | – | accepted |
| H2 | Employee quality → communication quality | 0.14 | 0.082 | 1.7 | 0.09 | accepted |
| H3 | Communicational strategy → communication quality | 0.12 | 0.089 | 1.3 | 0.17 | rejected, not significant |
| H4 | Resource integration → communication quality | −0.04 | 0.092 | −0.4 | 0.67 | rejected, not significant |
| H5 | Communication quality → customer value | 1 (reference path) | – | – | – | accepted |
| H6 | Communication quality → social value | 0.15 | 0.086 | 1.7 | 0.08 | accepted |
| H7 | Communication quality → financial value | 0.12 | 0.105 | 1.2 | 0.24 | rejected, not significant |
Unstandardized estimates of the initial model. S.E. stands for the standard error, C.R. for the critical ratio. The numbering follows the development of the hypotheses in the thesis (section 3.4.2).
Four of the seven core hypotheses were accepted. Two of them, H1 and H5, are reference paths (not tested individually; explanation); the thesis nevertheless counts them as accepted. H2 and H6 were tested individually and accepted.
The partial hypotheses
Each core hypothesis has two or three partial hypotheses, one per indicator. They test whether the individual statements of the questionnaire represent their factor. Here, too, one indicator per factor serves as the reference.
| No. | Indicator | Estimate | p | Result |
|---|---|---|---|---|
| H1a | democratic co-determination | 0.28 | 0.01 | accepted |
| H1b | charismatic behaviour | 0.20 | 0.06 | accepted |
| H1c | organizational identification | 1 (reference) | – | accepted |
| H2a | employee satisfaction | 0.14 | ≈ 0.13 | counted as accepted by the study |
| H2b | entrepreneurial orientation | −0.03 | 0.72 | rejected |
| H2c | communicative competence | 1 (reference) | – | accepted |
| H5a | customer attitude | 0.10 | 0.27 | rejected |
| H5b | customer loyalty | −0.01 | 0.88 | rejected |
| H5c | customer trust | 1 (reference) | – | rejected |
| H6a | public interest | −0.83 | 0.28 | rejected |
| H6b | reputation gains | 1 (reference) | – | rejected |
| H7a | stock or market value | 0.37 | 0.67 | rejected |
| H7b | return on equity (ROE) | 1 (reference) | – | rejected |
| H7c | Tobin’s q | 0.18 | 0.82 | rejected |
Assignment of the indicators according to the questionnaire and data set of the study. For H2a, the study gives p as 0.1, rounded; from the estimate and standard error (C.R. 1.5), p ≈ 0.13 results. The study nevertheless counts H2a as accepted. The partial hypotheses H3a to H4c on strategy and resources are on the page Strategy and resources.
On the side of the enablers, the partial hypotheses confirm the picture of the core hypotheses. Co-determination and charisma are significant; identification is the reference. Among the employees, entrepreneurial orientation drops out (p = 0.72); satisfaction lies above the threshold at p ≈ 0.13 and is nevertheless counted as accepted by the study. For strategy, informational competence drops out, and for resources no indicator is significant. On the success side, not a single indicator in the initial model is significant in its own right. The core hypotheses H5 and H6 therefore hold for the factors as a whole, not for individual statements. This is where the amendments started.
What the initial model says
As the thesis reads it, the contractors associate good agency work above all with people. Leadership (reference path, counted as accepted by the study) and employees (p = 0.09) are regarded by the study as the bearers of the perceived quality; the strategic positioning of an agency (p = 0.17) and its networking with partners (p = 0.67) are not. On the success side, the study counts the paths to customer value (reference path) and to social value (p = 0.08) as accepted. For financial value, measured by stock or market value, return on equity and Tobin’s q, no significant effect could be demonstrated (p = 0.24).
Three amendments up to the final model
The study then changed the initial model step by step and removed weak indicators and factors. The calculations are documented in the appendix of the thesis.
- Amendment 1. Entrepreneurial orientation and informational competence form a new factor, “organizational performance”. Resource integration and financial value are dropped. Public interest, reputation gains and customer loyalty are linked directly to communication quality. The new factor is not significant (p = 0.95). Public interest (−0.12, p = 0.18) and customer loyalty (−0.03, p = 0.77) show negative, not significant paths; reputation gains are significant at the 10% level (0.15, p = 0.09). The model comprises 14 observed variables.
- Amendment 2. Organizational performance, public interest and customer loyalty are dropped. On the side of the enablers, most indicators are now significant. On the other hand, customer value is no longer significant; customer attitude reaches 0.10 (p = 0.30). Employee quality stands at 0.14 (p = 0.09), strategy at 0.13 (p = 0.16). The model comprises ten observed variables.
- Amendment 3, the final model. The factor customer value and customer attitude are dropped. Customer trust and reputation gains are linked directly to communication quality. The model comprises nine observed variables.
The reduction follows the data. It makes the model simpler but is not a retrospective confirmation of the initial assumptions. What dropped out is itself a result. For resources, financial value, public interest, customer loyalty, informational competence, entrepreneurial orientation and customer attitude, the survey found no significant relationship with the perceived quality.
The final model
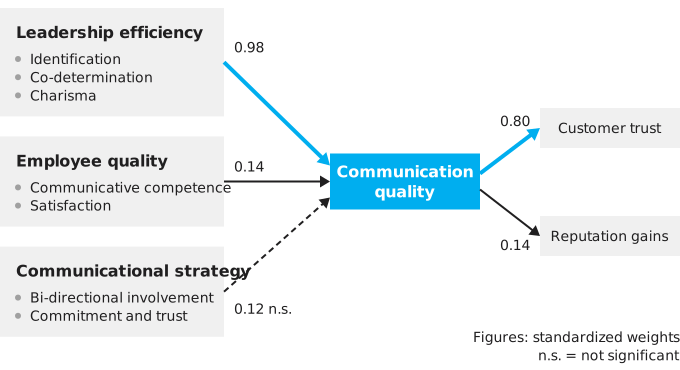
- Leadership efficiency, measured by identification with the organization, democratic co-determination and charismatic behaviour, acts on communication quality with a weight of 0.98, the highest standardized weight in the model.
- Employee quality, measured by communicative competence and satisfaction, acts with 0.14.
- Communicational strategy, measured by bi-directional customer involvement and customer commitment and trust, acts with 0.12; this path is not significant (dashed).
- Communication quality acts on customer trust with 0.80, the strongest success parameter, and on reputation gains with 0.14.
- All figures are standardized weights of the final model.
The final model consists of three enablers, the mediating variable communication quality and two success indicators. Leadership efficiency is measured by identification, co-determination and charisma, employee quality by communicative competence and satisfaction, communicational strategy by bi-directional customer involvement as well as customer commitment and trust.
| Path in the final model | Estimate | p | Standardized weight |
|---|---|---|---|
| Leadership efficiency → communication quality | 1 (reference) | – | 0.98 |
| Employee quality → communication quality | 0.14 | 0.093 | 0.14 |
| Communicational strategy → communication quality | 0.12 | 0.166, not significant | 0.12 |
| Communication quality → customer trust | 1 (reference) | – | 0.80 |
| Communication quality → reputation gains | 0.14 | 0.098 | 0.14 |
Standardized weights make paths comparable that were estimated on different scales. In the study’s final model, leadership efficiency, with a standardized weight of 0.98, is by far the strongest factor. Employee quality follows with 0.14, communicational strategy with 0.12, not significant. On the success side, customer trust is by far the strongest success parameter (standardized weight 0.80); reputation gains follow with 0.14. How the individual enablers were measured is shown by the pages on leadership efficiency, employee quality and strategy and resources.
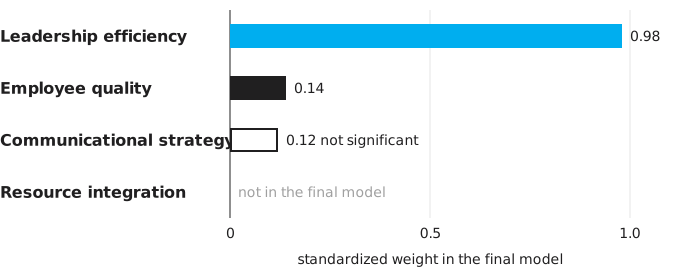
- Leadership efficiency: standardized weight 0.98, the strongest enabler.
- Employee quality: 0.14.
- Communicational strategy: 0.12, not significant.
- Resource integration: no longer included in the final model.
The thesis summarizes the final model in two statements. The quality of agency work depends strongly on the agency’s leadership. And this quality shows itself in the trust of the contractor’s customers and in the contractor’s standing, while an effect on financial results could not be demonstrated. Within the leadership factor, the leaders’ identification with the organization carries the most weight in the final model (0.58), followed by co-determination (0.20) and charisma (0.16).
How the contractors rate their agencies
The means of all 20 statements lie between 3.14 and 3.80. The level of a judgment says nothing about whether it explains quality. Customer loyalty received the highest mean and nevertheless dropped out of the model, and knowledge management was rated better than any feature of leadership and remained without a significant relationship with quality. The success values in detail can be found under Communication success.
How far the results reach
The findings are findings of this study and this sample. Contractors of two international agency networks were surveyed. Cross-relationships between the enablers are not modelled, although the literature suspects them. It also remains open whether the trust gained makes the contractors more competitive in the long term. This question lay outside the study. The page Limitations and outlook elaborates on these points.
According to these results, agency work shows itself above all in the relationship between contractors and their customers. How success in communication differs from marketing success is shown by the page Communication success.

QMC model
Unlike the EFQM, the model measures financial value directly and lists employees only as an enabler.
Method
After the pre-test, 20 of the 26 measurement categories from the literature remained for the questionnaire.
Leadership
In the final model, leadership efficiency is the strongest enabler, with a standardized weight of 0.98.
Employee quality
Employee quality follows at 0.14 and rests almost entirely on communicative competence.
Strategy and resources
At 0.12 the strategy remains not significant, and resource integration drops out of the model.
Communication success
Customer trust (0.80) and reputation (0.14) remain; no significant effect shows for financial key figures.