
What the findings mean for agencies and contractors
In the final chapter, the thesis asks which conclusions the leadership and employees of a communication agency can draw from the results. What companies that commission agencies can expect follows from the purpose that the thesis assigns to the model and from the findings on the success side. The basis is the judgments of 209 contractors who rated their agency and the effect of a completed project.
The leadership carries the quality
The strongest finding concerns the leadership. In the final model, leadership efficiency lies far ahead of the other enablers. Leadership efficiency was measured by three features of the agency’s leadership, the co-determination of employees, a charismatic demeanour and identification with the organization as a whole.
Why the leadership carries so much weight in day-to-day agency work and which characteristics distinguish successful agency leaders is explained by the page Leadership. The finding comes with a qualification. Cross-relationships between the enablers are not represented in the model (Limitations).
Informal before formal
How openly information flows in an agency depends, according to the conclusion of the thesis, less on established quality routines than on informal exchange. The survey did not measure this exchange; the thesis derives it from the results. According to this interpretation, informal conversations promote new ideas, and creative work arises more readily in open than in rigidly regulated processes. Formalized quality management (QM) concepts offer an agency little internally. Effective quality management is shaped by those responsible themselves, tailored to the individual project and the individual customer.
As the primary task for agencies, the study names strengthening informal management practices. Executives should encourage employees to get in touch with one another privately as well, and meet new ideas openly.
Communicative skill before entrepreneurial spirit
Employee quality is the second-strongest enabler. In the final model, it rests almost entirely on communicative competence (standardized loading 0.95). Even in the initial model, no significant effect could be demonstrated for entrepreneurial orientation (p = 0.72); the thesis’s interpretation can be found under Employee quality.
The situation is similar with the agency’s informational competence, which is likewise not significant. The study suspects a shift from rational to emotional factors behind this. For contractors, it would accordingly be more important to feel integrated into a committed network than to have specialist information conveyed to them.
Inside before outside
From the survey, the thesis concludes that the interplay within the agency counts for more than a dense network of suppliers and partners. Resource integration, measured by knowledge management, electronic systems in the supply chain and the integration of customers into learning processes, shows no significant effect on communication quality (p = 0.67) and is absent from the final model. How the thesis interprets this can be found on the same page.
Learning from completed projects
The QMC model takes over a learning loop from the European Foundation for Quality Management (EFQM) model. Success is evaluated and flows back to the enablers. From the primacy of internal interplay, the thesis derives that the enablers improve when insights from earlier projects continuously flow back into the work.
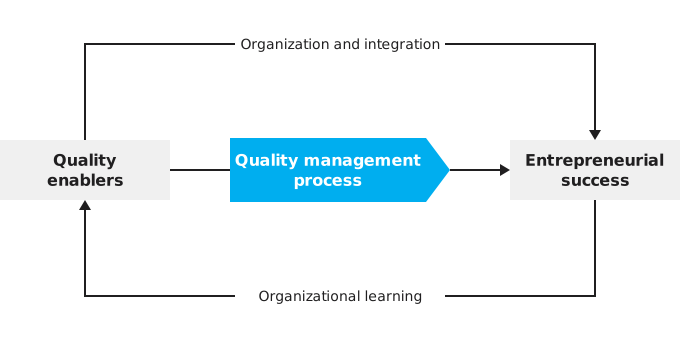
- On the left the quality enablers, on the right entrepreneurial success, between them the quality management process.
- Upper arc: through organization and integration the enablers lead to success.
- Lower arc: through organizational learning, success flows back to the enablers.
- Both arcs form a continuous cycle of improvement.
The study describes concretely how this could be organized. It proposes regular meetings that deal with the wishes of customers and the concepts of competitors and lead to plans for how new ideas become new offerings. Whether such learning succeeds depends, according to the study, on the leadership’s willingness to take up new market needs and ideas from the team.
What contractors can expect
For companies that commission agencies, the model is intended as an assessment instrument. It is meant to help assess the core competences of an agency and the effect that can be expected of it. The success side of the model sets the expectations here. In the final model, customer trust is the strongest success parameter, by a clear margin ahead of reputation gains. A relationship between communication quality and stock value, return on equity (ROE) or Tobin’s q could not be demonstrated (reasons). According to the study, trust and reputation depend on an idiosyncratic communication strategy that is tailored to the contractor’s target customers. This is a conclusion of the thesis; the strategy factor itself was not significant in the survey.
| Finding of the study | What can be derived from it for assessing agency work |
|---|---|
| Leadership efficiency is by far the strongest enabler (standardized 0.98) | Look at how the leadership works, that is, co-determination in the team, demeanour and identification with its own agency |
| Employee quality rests almost entirely on communicative competence (loading 0.95) | Weight the team’s communicative skill more heavily than a pronounced business orientation |
| Resource integration without a significant effect (initial model: estimate −0.04, p = 0.67) | Knowledge management and electronic systems in the supply chain said little about the perceived quality in this study |
| Customer trust the strongest success parameter (0.80), reputation 0.14 | Measure the success of a project first by the trust of one’s own customers and the standing of the company |
| no significant effect on financial key figures (initial model, p = 0.24) | Set expectations of short-term returns from individual projects cautiously |
Weights 0.98, 0.95 and 0.80: standardized, final model.
How far the conclusions reach
The conclusions are based on the perception of contractors from the customer bases of two international agency networks. The respondents assessed enablers and success themselves; balance sheet data or measurements among their customers do not form the basis. The model was reduced in three steps, and cross-relationships between the enablers are not represented (Limitations of the study). For practice, the findings are therefore well-founded indications of where quality arises in agencies. The study does not describe them as proven levers that work the same way in every agency.

QMC model
Unlike the EFQM, the model measures financial value directly and lists employees only as an enabler.
Method
After the pre-test, 20 of the 26 measurement categories from the literature remained for the questionnaire.
Results
After three amendments, a final model with three enablers and two success parameters remains.
Leadership
In the final model, leadership efficiency is the strongest enabler, with a standardized weight of 0.98.
Employee quality
Employee quality follows at 0.14 and rests almost entirely on communicative competence.
Communication success
Customer trust (0.80) and reputation (0.14) remain; no significant effect shows for financial key figures.