
Leadership efficiency in communication agencies
Leadership efficiency is one of four communication enablers with which the study explains the quality of agency work. It refers to features of agency leadership that enable sound communication decisions and careful workflows. The thesis tested the factor in three stages: in the specialist literature, in conversations with executives of two internationally active agencies and in a survey of 209 contractors. Leadership withstood all three stages. In the survey, it lay so far ahead of the other factors that it dominates the final model.
What leadership efficiency means in the QMC model
Leadership efficiency corresponds to the EFQM criterion of leadership but receives more weight in the QMC model, the quality management model for the communication industry. According to the literature, leadership acts on employees, strategy and resources. The literature review found no effect in the opposite direction.
What is measured is how contractors experience the leadership, not its behaviour itself. The respondents rated three statements about the agency they had worked with, from 1 (poor performance) to 5 (top performance).
- The agency’s leadership allows and encourages democratic co-determination of employees.
- The agency’s leadership is characterized by charismatic behaviour.
- The agency’s leadership shows identification with the organization as a whole.
What the specialist literature led one to expect
For the literature part, the study evaluated 31 empirical studies on quality factors in the communication business. Nine of them deal with leadership. The theoretical framework is provided by leadership research. Hambrick and Mason argue that the perceptions, values and emotions of top management determine the strategic decisions and thus the success of an organization. Mehrotra distinguishes an authoritarian, boss-centred style from a democratic, employee-centred one. Avolio and Bass separate transactional from transformational leadership. At the same time, several authors point out that leadership is hard to measure because every judgment about superiors remains subjective.
The empirical studies point in the same direction. In a large government organization, charismatic and people-oriented leadership promoted open communication, while task-oriented leadership slowed exchange at the operational level (De Vries and colleagues). In Chinese information companies, a style that leaves employees to make their own decisions increased their motivation and creativity (Zhang and Bartol). In an Indian communication organization, charismatic superiors encouraged their teams more strongly than autocratic ones to discuss failures critically (Shastri and colleagues). Homburg and colleagues show that executives’ identification with their company transfers to employees and improves success in customer contact.
From these findings, the study derived four features of agency leadership that promotes quality.
- high communicative openness
- democratic co-determination of employees
- charismatic behaviour
- strong identification with the organization
What the pre-test changed
For leadership, it was communicative openness that was affected in the pre-test. Several interviewees saw an overlap with co-determination; one considered openness to be a feature of the whole organization rather than of an individual executive. Democratic co-determination received the highest value of the four leadership categories.
| Feature | Relevance in the pre-test (0 to 3) | Difference to the total mean | Decision |
|---|---|---|---|
| communicative openness | 1.17 | −0.54 | discarded |
| democratic co-determination | 1.83 | +0.13 | retained as L1 |
| charismatic behaviour | 1.75 | +0.05 | retained as L2 |
| organizational identification | 1.75 | +0.05 | retained as L3 |
What the survey of the contractors shows
The 209 contractors who completed the questionnaire in full gave the leadership of their agency predominantly good marks. Co-determination reached a mean of 3.48, charisma 3.44, identification 3.31. For all three features, just over half of the respondents chose one of the two upper levels, between 53 and 55% depending on the feature.
Means say little about what explains quality. That is answered only by the structural equation model. It estimates how strongly each enabler determines communication quality, which cannot be measured directly. In the initial model with all four enablers, the path from leadership to communication quality serves as the reference; its weight is fixed at 1. Co-determination (0.28; p = 0.01) and charisma (0.20; p = 0.06) loaded significantly on their factor; identification served as the reference indicator. The study counts the partial hypotheses H1a to H1c and the core hypothesis H1 as accepted; H1 and H1c are reference paths and were not tested individually.
Because the initial model was only partly confirmed, the study reduced it in three steps. The final model contains three enablers and two success parameters. In it, leadership efficiency reaches a standardized weight of 0.98 and lies far ahead of the two other enablers. Standardized weights convert the paths to a common unit and make them comparable. All paths and hypotheses are set out under Results.
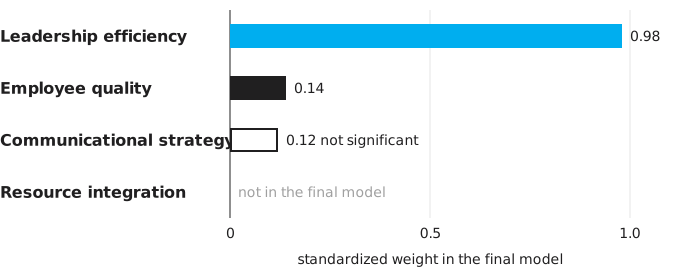
- Leadership efficiency: standardized weight 0.98, the strongest enabler.
- Employee quality: 0.14.
- Communicational strategy: 0.12, not significant.
- Resource integration: no longer included in the final model.
Within the factor, the weight is distributed unevenly. The leaders’ identification with the organization received the lowest mean of the three features from the contractors. In the final model, it is nevertheless the indicator that shapes the factor most strongly.
| Feature in the final model | Estimate | p | Standardized weight |
|---|---|---|---|
| organizational identification | 1 (reference) | – | 0.58 |
| democratic co-determination | 0.26 | 0.019 | 0.20 |
| charismatic behaviour | 0.21 | 0.051 | 0.16 |
Why the leadership carries so much weight
The thesis explains the finding by the role of the leadership in everyday agency life. Particularly in smaller agencies, leaders maintain contact with the contractor, shape the contracts and ensure a steady flow of tasks. Requests, approvals and complaints converge on them. The thesis therefore sees in the leadership the pivot at which every improvement in communication quality starts.
A second finding fits with this. An agency’s network, its systems and partners, showed no significant relationship with perceived quality. How the thesis interprets this relationship is set out on the page on Strategy and resources.
Here the study sees its contribution to the state of research. Earlier studies examined employees’ satisfaction, commitment or competence without measuring how strongly this performance depends on the example set by the leadership. By its own account, the study quantifies the importance of agency leadership for the first time in a survey, at least for the sample examined.
How robust the finding is
The figure 0.98 comes with three qualifications.
First, the path from leadership to communication quality is a reference path (not tested individually; explanation). The same applies to identification as the reference indicator. In the preceding confirmatory factor analysis, it was not significant in itself.
Second, cross-relationships between the enablers are not modelled. What this means for the weight of the leadership is described on the page Limitations and outlook.
Third, all values come from judgments of contractors who were customers of two agency networks. They describe how contractors experience agency leaders, and not how these actually lead.
Conclusions for agency leaders
As features of successful agency leaders, the thesis names charisma, identification with the organization, personal commitment and a democratic style. Two conditions come on top of professional competence: promoting conversation in the team and allowing new ideas. What follows from this for everyday agency life is set out under Practice.

QMC model
Unlike the EFQM, the model measures financial value directly and lists employees only as an enabler.
Method
After the pre-test, 20 of the 26 measurement categories from the literature remained for the questionnaire.
Results
After three amendments, a final model with three enablers and two success parameters remains.
Employee quality
Employee quality follows at 0.14 and rests almost entirely on communicative competence.
Strategy and resources
At 0.12 the strategy remains not significant, and resource integration drops out of the model.