
QMC model
QMC stands for quality management model for the communication industry. The model describes how characteristics of an agency lead, via the quality of its work, to success at the contractor, and how this success flows back into the agency as learning. It arose from a literature review, was refined in a pre-test with executives from agencies and was then tested against the judgments of 209 contractors.
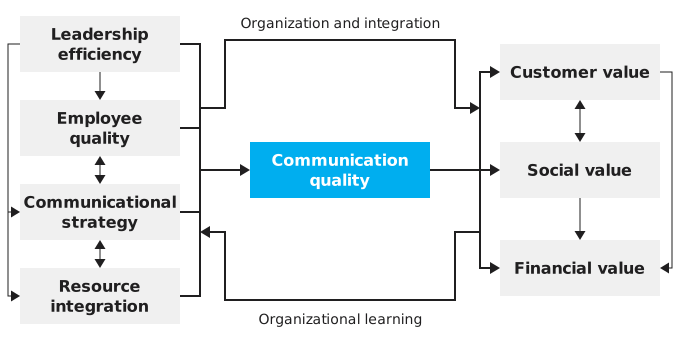
- On the left, the agency’s four communication enablers: leadership efficiency, employee quality, communicational strategy and resource integration.
- Leadership acts on the three other enablers; employee quality, strategy and resources influence one another.
- Together, the enablers determine the communication quality in the middle.
- Communication quality acts on three success parameters at the contractor: customer value, social value and financial value.
- Customer value and social value influence each other; both act on financial value.
- A cycle surrounds the middle: at the top, organization and integration on the way to success; at the bottom, organizational learning on the way back to the enablers.
Three levels and a loop
On the left are four communication enablers. These are resources and concepts of the agency, material as well as immaterial, which determine how well a communication process succeeds. In the middle is communication quality. It cannot be observed directly. The model treats it as a latent variable that arises from the interplay of the enablers and shows itself in success. On the right is communication success, measured at the contractor in three values.
A loop connects both sides. Its upper arc stands for organization and integration of the enablers, the lower for organizational learning. An agency evaluates the success achieved and uses it to improve its enablers, which carry the next success. The model takes over this continuous improvement cycle from the European Foundation for Quality Management (EFQM) model.
The building blocks in detail
From 31 studies on the prerequisites of good communication and 24 studies on the measurement of success, the thesis derived 26 categories, four per enabler and three or four per success parameter. The pre-test discarded six of them. What remained were seven variables with a total of 20 indicators, which went into the questionnaire.
| Level | Variable | Indicators in the questionnaire |
|---|---|---|
| Enabler | Leadership efficiency | democratic co-determination, charismatic behaviour, leaders’ organizational identification |
| Enabler | Employee quality | employee satisfaction, entrepreneurial orientation, communicative competence |
| Enabler | Communicational strategy | informational competence of the agency, customer commitment and trust, bi-directional customer involvement |
| Enabler | Resource integration | frictionless knowledge management, electronic systems in the supply chain, integration of customers into learning processes |
| Success | Customer value | attitude, loyalty and trust of the contractor’s customers |
| Success | Social value | public interest, reputation and image gains |
| Success | Financial value | stock value or market value, return on equity, Tobin’s q |
The contractors rated the enablers of their agency from 1 for poor to 5 for top performance. The statements on success referred to their own company and a completed project, likewise in five levels from no consent to maximum consent.
Origin in the EFQM
The four enablers are modelled on the categories of the EFQM model; the thesis has tailored their names to the communication business. Leadership efficiency corresponds to leadership, employee quality to employees, communicational strategy to policy and strategy, resource integration to resources and partners. Why the study starts from the EFQM and not from ISO 9001 or Total Quality Management (TQM) is shown by the comparison of the three models.
What the model does differently
- Leadership receives a special position. According to the literature, leadership acts on all other enablers; an effect in the opposite direction is not documented. The QMC model therefore weights it more heavily than the EFQM. At the same time, it leaves employees scope, since in agencies tasks often arise only in conversation with the customer.
- Financial value is measured directly. The EFQM captures it only indirectly via employees, customers and society. The QMC model lists it as a success parameter of its own, always together with customer value and social value, because financial key figures alone do not give a complete picture.
- Employees appear only on the input side. In the EFQM they appear twice, as an enabler and as a result. Cause and effect then depend on each other and cannot be measured separately. The QMC model assigns employee quality to the enablers alone.
Presumed cross-relationships
In the draft derived from the literature, leadership influences the three other enablers. Employees, strategy and resources act on one another reciprocally; a highly formalized strategy, for example, can demotivate employees. On the success side, customer value and social value are connected, and both are supposed to raise financial value in the long run. The estimated structural equation model does not depict these cross-relationships because the literature hardly quantifies them. The study itself counts this among its limitations.
What remained of the model
The survey confirmed the model only in part. Four of seven core hypotheses were accepted, two of them being reference paths. In three steps the model shrank to three enablers and two success measures. Resource integration and financial value dropped out. In the final model, leadership efficiency lies far ahead of the other enablers, and on the success side customer trust lies ahead of reputation gains. Weights, paths and the three amendments are found under Results.
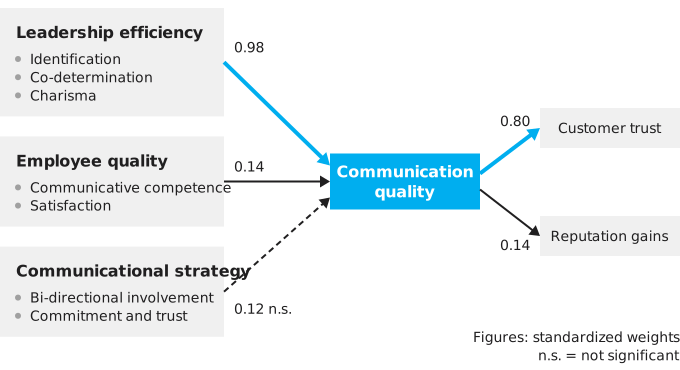
- Leadership efficiency, measured by identification with the organization, democratic co-determination and charismatic behaviour, acts on communication quality with a weight of 0.98, the highest standardized weight in the model.
- Employee quality, measured by communicative competence and satisfaction, acts with 0.14.
- Communicational strategy, measured by bi-directional customer involvement and customer commitment and trust, acts with 0.12; this path is not significant (dashed).
- Communication quality acts on customer trust with 0.80, the strongest success parameter, and on reputation gains with 0.14.
- All figures are standardized weights of the final model.
What the model is for
The thesis assigns two tasks to the model. For agencies, it shows which enablers they can start from, and it gives them arguments towards their contractors. For contractors, it serves as a grid for assessing an agency’s core competences and their influence on the expected success. According to the findings, the most worthwhile thing to look at is the agency’s leadership, and trust and reputation are more likely to be expected than a quick return. More on this under Practice.

Research question
None of the studies evaluated examined agencies as intermediaries of professional communication.
ISO 9001, TQM and EFQM
For none of the three models did the study find an application in the communication business.
Leadership
In the final model, leadership efficiency is the strongest enabler, with a standardized weight of 0.98.
Communication success
Customer trust (0.80) and reputation (0.14) remain; no significant effect shows for financial key figures.
Method
After the pre-test, 20 of the 26 measurement categories from the literature remained for the questionnaire.