
Method of the study
The study works in three stages that build on one another. A systematic literature review supplies the categories for a first model. Executives from two international communication agencies rate these categories in a pre-test; whatever lies clearly below the average is dropped. Then contractors of agencies rate the remaining 20 indicators in a questionnaire. A structural equation model (SEM) estimates from these answers which factors in the agency are associated with what success at the contractor.
Here, the subject is stance, procedure and evaluation. The findings can be found under Results, the model under QMC model.
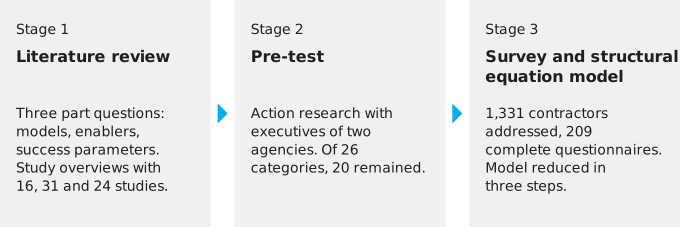
- Stage 1, literature review: three part questions on models, enablers and success parameters; overviews of 16, 31 and 24 studies.
- Stage 2, pre-test: action research with executives of two agencies; of 26 categories, 20 remained.
- Stage 3, survey and structural equation model: 1,331 contractors addressed, 209 complete questionnaires evaluated, the model reduced in three steps.
The stance of the research
The thesis aligns itself with critical realism, as described by Bhaskar and by Marsh and Furlong. On this view, a reality exists independently of the observer. Research always captures it, however, in a social and personal context, and its knowledge remains provisional. The study thereby distinguishes itself from positivism, which wants to derive theories from observation alone.
Two decisions follow from this stance. Figures from the survey are placed in a qualitative context and not read on their own. And a deductive approach is permissible, in which assumptions from the literature are tested against the study’s own data.
As justification, the thesis draws on Brunswik’s lens model. According to it, perception runs through filters of perception and of judgment that are fed by earlier knowledge. Whoever interprets data never does so from a neutral point. For this reason, the final chapter examines the findings from five perspectives:
- from the perspective of the academic community,
- from the perspective of a critical researcher who questions validity and reliability,
- from the perspective of a social planner who asks about transferability and durability,
- from the author’s personal perspective,
- from the perspective of an agency that wants to apply the model.
The impetus for this comes from Feenberg’s call for a plurality of perspectives.
The literature review
The first stage answers three of the thesis’s four part questions from the state of research (see Research question). Which models of quality management (QM) exist, and have they been tested in the communication business? Which factors, according to earlier empirical work, contribute to the quality of communication processes? With which variables have earlier studies measured communication success?
Searches were run in four databases: Google Scholar, EBSCOhost with EconLit, Emerald Insight and Scirus. Journal articles thus entered the selection as well as academic theses, in German and in English. Each part question had its own search terms. For the enablers, the search combined, for example, “commercial communication”, “marketing communication” and “public relations” with terms for prerequisites and the addition “empirical”. Because hardly any studies on quality management existed for the communication business itself, the search for the first question was extended to services in marketing and public relations. Each list of hits was re-sorted by hand.
In the end there were three overviews of studies, with 16 works on quality management models, 31 on quality enablers and 24 on measures of communication success. From these, the thesis derived several observable categories for each building block of the model, 26 in total. They form the literature-based initial model, an adaptation of the European Foundation for Quality Management (EFQM) idea to agencies. How ISO 9001, Total Quality Management (TQM) and EFQM perform in this respect is shown by the comparison of the three models.
The pre-test in two agencies
Before a questionnaire went out to contractors, the study tested the initial model in practice. For this it chose action research. The approach goes back to Kurt Lewin, who described research as a spiral of planning, intervention, discovery and change. Argyris added the distinction between single loop and double loop learning, and French and Bell transferred the procedure to organizations. The thesis takes the names of the phases, unfreezing, changing and refreezing, from Johnson.
For this choice, the thesis gives a substantive reason. Communication quality arises in the dialogue of those involved, and action research makes those involved into contributors to the research. Moreover, anyone who takes part in the testing understands the model better and can apply it more easily later. The study answers the objection that action research neglects theory with a clear boundary. The pre-test starts from the model from the literature and tests only its categories.
The people questioned were executives from two international communication agencies with many years of experience in quality management. All of them were themselves involved in the QM processes of their agency. The conversations took place in the agencies’ offices and followed five steps.
- Presentation of the project and the initial model to employees of the agency (unfreezing).
- Guided interviews with executives and a discussion of the model (changing).
- Rating of each category during the conversation, on a scale from 0 (no relevance) to 3 (high relevance).
- Free comments on whether a category is in the right place in the model.
- Consolidation of all ratings in a table and fixing of the new structure (refreezing).
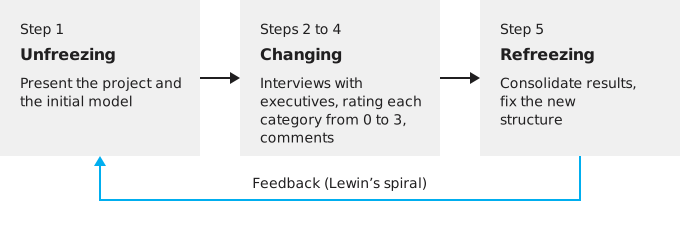
- Unfreezing, step 1: the project and the initial model are presented at the agency.
- Changing, steps 2 to 4: interviews with executives, rating of each category on a scale from 0 to 3, comments on the assignment.
- Refreezing, step 5: the ratings are consolidated and the new structure of the model is fixed.
- A return path closes the circle to the spiral of planning, action and fact-finding after Lewin; the fixed structure is the starting point for further model development.
The key figure of the pre-test
The evaluation is deliberately kept simple. For each category, the thesis calculates the mean across all respondents, and also the mean across all categories and respondents. The difference between the two values shows whether a category lies above or below the average. The total mean was 1.70 out of 3 points. Categories whose mean lay clearly below it were discarded; the respondents’ comments supplied the reasons. Of 26 categories, 20 remained.
| Area | Discarded category | Mean (0–3) | Difference to the total mean | Reason from the conversations |
|---|---|---|---|---|
| Leadership | communicative openness | 1.17 | −0.54 | overlaps with democratic co-determination, describes the organization rather than the leadership |
| Strategy | individual customer appeal | 1.17 | −0.54 | overlaps with customer trust, more a feature of the product than of the strategy |
| Employees | employee commitment | 1.25 | −0.45 | can hardly be separated from satisfaction and entrepreneurial orientation |
| Resources | customers’ word of mouth | 1.25 | −0.45 | belongs to strategy or is a form of customer integration |
| Social value | employee motivation | 1.17 | −0.54 | would capture employee topics twice |
| Social value | reduced business risk | 1.58 | −0.12 | unclear to several respondents, some rather expected higher risks from expensive investments |
For reduced business risk, the difference to the mean was the smallest at 0.12 points; here the objections raised in the conversations tipped the balance. Conversely, all three financial variables remained in the model, although respondents considered them speculative and measurable only in the long term. Their means lay above the average.
The thesis itself names the limits of this stage. The selection of respondents is not statistically representative, their judgment depends on personal experience, and the conversation partners at one agency were more detailed in their comments than those at the other. The pre-test sharpens the categories. The model is tested only in the third stage.
The survey of the contractors
The main survey is addressed to the contractors of agencies. They assess the agency from first-hand experience and directly experience the effect of the work, through feedback from customers and the public, in the annual accounts or in the share price.
The addresses come from the customer databases of the two agencies, which comprise several tens of thousands of entries. Companies, not private individuals, that had awarded a completed order with a volume of more than €100,000 were selected. All respondents therefore knew a project that could have a noticeable effect and that they remembered. The filter yielded 1,331 addresses. They were invited by e-mail through an online survey system, with a reference to the scientific purpose.
The questionnaire begins with three classification questions, on the branch, on the number of employees in five EU economic size classes and on the position of the person responding. These are followed by 20 test statements, one per indicator. Twelve statements concern the agency, for example whether its leadership allows the co-determination of employees. Respondents rated them from 1 (poor performance) to 5 (top performance). Eight statements concern the respondent’s own company after the project, for example whether customer trust has grown. Here the scale ran from 1 (no consent) to 5 (maximum consent). Companies without a stock exchange listing could use the value for their shareholders as the basis for market value.
The survey was anonymous. The researcher knew neither names nor other personal data. Position and answers were stored separately, and the questionnaires were destroyed after the evaluation. Questions concerned only professional assessments, not private topics.
Only complete questionnaires were evaluated. With 209 data records, the sample meets the rule of thumb that the thesis follows, with at least ten cases per indicator and at least 200 cases in total.
| Participation quota | Number | Share |
|---|---|---|
| addressed | 1,331 | 100% |
| no answer | 1,033 | 77.6% |
| response received | 298 | 22.4% |
| of which incomplete | 89 | 6.7% |
| complete questionnaires | 209 | 15.7% |
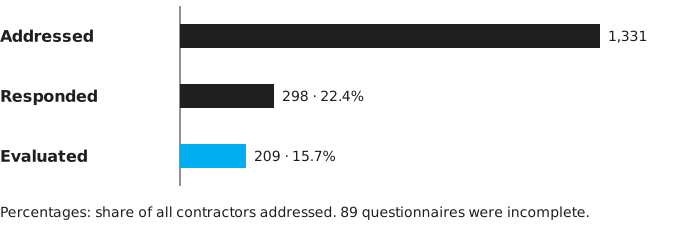
- Addressed: 1,331 contractors.
- Responded: 298 (22.4%); 1,033 of those addressed did not respond.
- Evaluated: 209 complete questionnaires (15.7%); 89 questionnaires were incomplete.
The respondents come from manufacturing (72), from service companies (69), from sales (47) and from other branches (21). Of the companies, 107 have at most 400 employees, 37 between 401 and 1,000, and 65 more than 1,000. Of the respondents, 81 work in management, 58 are owners or CEOs, 59 are employees, and 11 name another position. The thesis explains the high share of large companies by the minimum volume of the orders.
The evaluation
A structural equation model estimates relationships between variables that cannot be observed directly. Leadership efficiency or customer value are such latent variables. They are captured through indicators, here through the 20 test statements. Unlike a regression or a path analysis, the method estimates the measurement model and the effect relationships in one step. The thesis is based on the deductive-nomological model of explanation by Hempel and Oppenheim, according to which relationships derived from theory are tested against data. The calculations were run with AMOS 21 and a maximum likelihood estimation.
The measurement model is reflective. The indicators reflect their construct but do not exhaust it. Because a literature review is never complete, components can be missing, for example a success that shows itself among the employees. Four constructs stand on the agency’s side, three on the contractor’s side. Between the two, the model places a mediating variable, communication quality. It arises from the enablers and shows itself in success.
The evaluation proceeded in four steps.
- Data check. Skewness and kurtosis of all 20 indicators lay within the usual limits, skewness between −0.08 and −0.62, kurtosis between −0.24 and −1.20. There were no missing values because only complete questionnaires were evaluated. On the basis of the Mahalanobis distance, the thesis found no conspicuous outliers.
- Confirmatory factor analysis (CFA). It tested the two partial models, enablers and success, initially separately. For nine of the 20 indicators, the p-value of the loading was below 0.10.
- Overall model. The partial models were connected via communication quality, and the seven core hypotheses were tested. A path with a p-value below 0.10 counted as significant. For each construct, one path is fixed at the value 1 (reference path, not tested individually; explanation). For the overall fit, the thesis reports Chi², Root Mean Square Residual (RMR), Goodness of Fit Index (GFI) and Root Mean Square Error of Approximation (RMSEA), and for each path the estimate, standard error, critical ratio and p-value.
- Amendments. In three steps, the thesis removed indicators and constructs that contributed nothing to the explanation.
From the initial model to the final model
Because the initial model was only partly confirmed and some indicators even showed negative weights, the thesis revised it in three steps. It attributes the negative values to the selection and assignment of the indicators. After each step, the model was estimated anew, until nine observed variables remained. Which variables were dropped at which step and which weights the final model shows can be found under Results, and how to read the weights under Method FAQ.
Limitations of the method
An exploratory factor analysis before the survey might, in the assessment of the thesis, possibly have grouped the indicators better. The thesis refrained from this because the pre-test had already tested the assignment. Cross-relationships between the enablers are not modelled, and all answers come from the customer bases of two agency networks. What this means for the reading of the results can be found under Limitations and outlook.

QMC model
Unlike the EFQM, the model measures financial value directly and lists employees only as an enabler.
Results
After three amendments, a final model with three enablers and two success parameters remains.Questions about the method
Twelve answers on the pre-test, sample, significance, weights and the three model amendments.
Research question
None of the studies evaluated examined agencies as intermediaries of professional communication.